Conservation mapping models can inform conservation decisions, provide a better understanding of natural resource distribution, and prioritize areas for conservation. The Norwalk Urban Conservation Mapping Project is a new tool developed by the Hudson to Housatonic Regional Conservation Partnership (RCP), the Norwalk Land Trust, and Highstead. The H2H partners focused on the city of Norwalk, Connecticut, as an extension of their initial 2018 Regional Mapping Project, which focused on identifying the areas of highest conservation value in rural and suburban places between the Hudson and Housatonic rivers in New York and Connecticut.
The 2021 project consists of an interactive online map and guide that presents Norwalk, Connecticut, as a case study for strategic mapping in an urban setting. Together, the map and guide broaden the definition of conservation to include additional city-specific forms of environmental health such as quality of urban greenspaces, citizen public health, and environmental justice issues like exposure to environmental hazards and access to open space.
The project’s success depended on outreach and input from more than twenty diverse Norwalk stakeholders and was driven by multiple communities’ priorities. Participation from landowners, city managers, and community organizations provided relevant data points, review, and overall project direction. The process of creating the Norwalk-specific urban mapping model, guide, and interactive map demonstrated the importance of urban conservation actions beyond land protection, like increasing neighborhood tree planting or understanding which communities are most at risk from climate change impacts and would benefit from more green infrastructure investments.
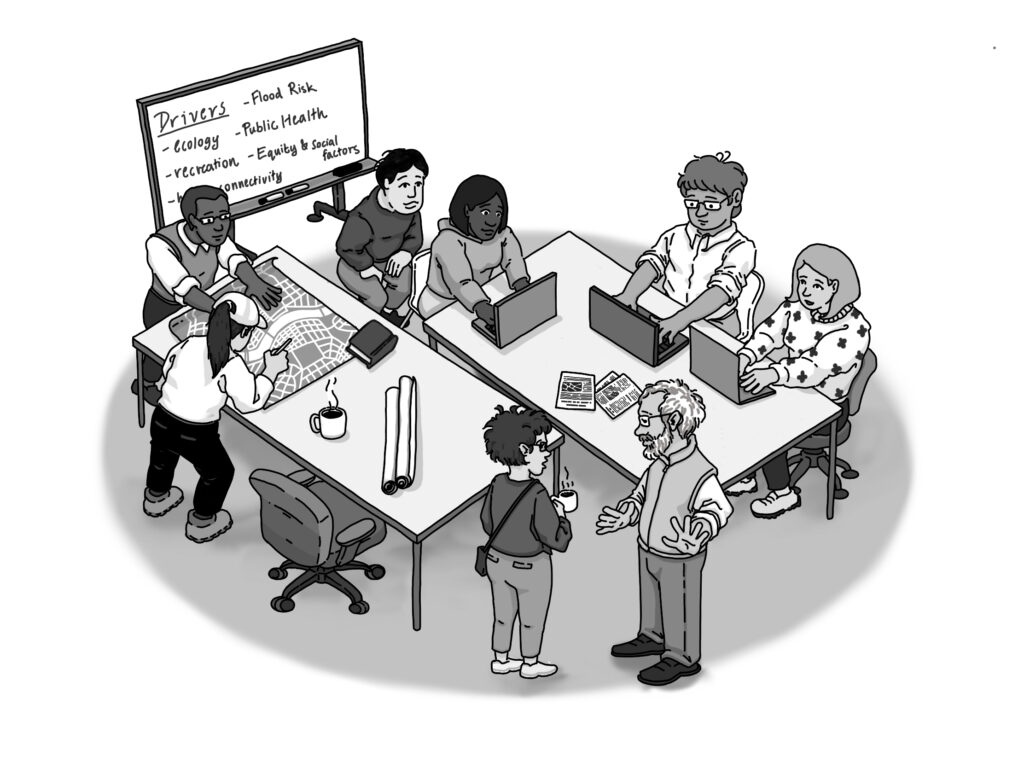
By evaluating the needs of people and natural spaces side by side, the project’s leaders determined a list of seven environmental and social values called “drivers,” all of which are important to urban conservation. Each driver is described by groups of GIS datasets called “criteria” that make up the map layers:
- Human Connectivity (criteria: public transportation, bike paths, walking routes, roads, park access),
- Urban Heat Island (tree canopy, impervious surface cover),
- Equity and Social Factors (% minority, % low-income, % less than high-school education, % under age five),
- Flood Risk (riparian buffers, flood zones, surface and groundwater quality, coastal boundary, inundation frequency),
- Recreation (parks, trail systems, historic landmarks),
- Public Health (asthma, diabetes, stroke, heart disease, and obesity rates, mental health, particulate matter concentration, respiratory hazards),
- and Ecological (biodiversity, habitat areas, high-quality shellfish habitat, natural land cover).
These drivers and criteria were then superimposed on a map of Norwalk to highlight areas where there was geographic “co-occurrence” or overlap of significant social, health, or environmental variables. Tool users can view these unique co-occurrence areas on the interactive map to see Norwalk’s priority urban conservation sites. Using the “Action Map” layers, tool users can view similar drivers and data used to produce a map that will guide a specific type of conservation action, such as “Priority Land for Conservation” or “Ensuring Equitable Access to Nature.”
While the methods and data sources described in the urban conservation mapping project guide were tailored to Norwalk city partner priorities, the project can still serve as an aid or jumping-off point for urban communities and city governments in determining their own urban conservation needs across the H2H region and beyond. In addition, the tool can be helpful in prioritizing urban conservation projects and directing the use of limited resources and funding, identifying new partnerships, enhancing community outreach, increasing fundraising potential, supporting grant applications, and facilitating transparency across environmental, public health, and government sectors.
The interactive online map and guide are available to the public. Please contact Highstead Conservationist and H2H Coordinator, Katie Blake with any questions or if you have experience in conservation mapping and have best practices or challenges to share.